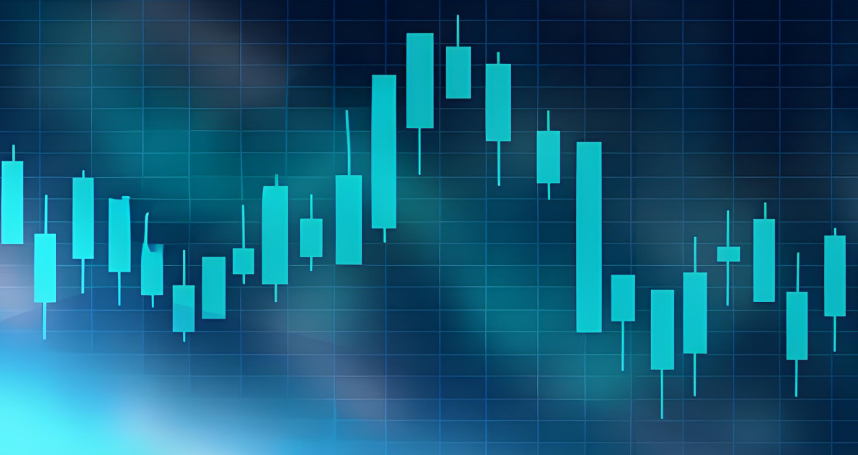
I remember staring at my first gold price chart like it was written in Ancient Greek. Candlesticks, moving averages, RSI — it felt overwhelming. But after years of trading and a fair share of losses, I can tell you this: once you learn to read the story the chart is telling, everything changes. Let me walk you through what actually matters.
Why Most Traders Get It Wrong (and How to Avoid It)
The biggest mistake? Treating a gold price chart like a crystal ball. It's not. It's a map of what has happened, not a guarantee of what will. Newbies jump on every breakout, ignore the larger trend, and end up buying at the top. I've been there too.
Another trap: overloading on indicators. You don't need 15 oscillators. In fact, the simpler your chart, the clearer the signal. I use just three: a 50-day moving average, a 200-day moving average, and volume. That's it. Once you strip away the noise, the trend becomes obvious.
The Only Chart Patterns You Need to Know
There are hundreds of patterns, but in gold trading, these three matter most:
- Head and Shoulders — reversing trend. I caught a massive gold move when the right shoulder formed below the neckline. Classic.
- Double Top / Double Bottom — price testing resistance or support twice. If it bounces off the same level twice, expect a reversal.
- Flags and Pennants — continuation patterns after a strong move. These are my favorite because they're quick and reliable.
One pattern most guides ignore: the rounded bottom. It's subtle but signals a slow, steady accumulation. I saw it in early 2020 before gold's rally. Patience pays.
Step-by-Step: How to Analyze a Gold Price Chart
1. Identify the Overall Trend
Start with a weekly chart. Are the lows getting higher? That's an uptrend. Lower highs? Downtrend. Sideways? Ranging. Don't trade against the daily trend unless you have a very good reason.
2. Mark Key Support and Resistance Levels
Draw horizontal lines at obvious highs and lows. Gold respects these levels like a religion. For example, $1900 has been both support and resistance multiple times. When price approaches these levels, watch for a bounce or a clean break.
3. Use Moving Averages to Gauge Momentum
Drop a 50-day and 200-day MA on your daily chart. If price is above both, the bulls are in control. If it's below, bears rule. When the 50-day crosses the 200-day, that's the golden/death cross I mentioned earlier.
4. Look for Divergence on RSI
The Relative Strength Index (RSI) measures overbought/oversold. But I use it for divergence: if price makes a higher high but RSI makes a lower high, trend is weakening. That's your warning to exit long positions.
5. Check Volume
Volume confirms the move. A breakout on low volume? Fakeout. A breakout on high volume? Legitimate. I've been burned by low-volume breakouts more times than I care to admit.
Top 3 Mistakes I've Made (and What I Learned)
- Over-leveraging after a win. I caught a nice rally and thought I was invincible. Then I doubled down, the chart reversed, and I gave back all profits. Now I risk no more than 2% per trade.
- Ignoring the macro picture. Gold doesn't trade in a vacuum. Dollar index, interest rates, geopolitical events — they all matter. A chart pattern that looks perfect might fail if the Fed is about to hike rates.
- Not waiting for the retest. When gold breaks a resistance level, it often retests it as support. I used to jump in on the breakout, only to get stopped out by the retracement. Now I wait for the retest and enter there.
Gold Price Chart vs Other Assets: A Quick Comparison
| Asset | Chart Behavior | Trading Tip |
|---|---|---|
| Gold (XAU/USD) | Tends to trend strongly, respects round numbers | Use weekly charts for long-term, hourly for entries |
| Silver | More volatile, larger gaps | Same patterns, but wider stops |
| S&P 500 | More gaps, less sensitive to USD | Correlates with gold inversely at times |
| Bitcoin | Extreme volatility, fewer historical levels | Patterns are less reliable |
Gold charts have a unique rhythm. They're slower than stocks, cleaner than crypto. That makes them ideal for learning technical analysis.
FAQ: Your Pressing Questions Answered
This article is based on personal trading experience and has been fact-checked against standard technical analysis principles. No system guarantees profits — always trade responsibly.


Comments
0